Measuring the Maintenance: From Spreadsheet to Python Script
I starting this thinking I needed a spreadsheet.
The goal was simple: find a better way to quantify the work I actually do. Record counts, cleanup efforts, error rates, trends. All of the things that are obvious day to day but difficult to explain when someone asks, “What have you been working on this year?”
The spreadsheet worked. Until I thought about maintaining it.
Getting data from Alma Analytics meant exports, copy and paste, and remembering to update things every month. I already knew how that story ended.
So the spreadsheet became a python script.
One of my favorite things about library systems work is how often I get the opportunity to stand on the shoulders of the library giants around me. Many of the Alma Analytics reports this project uses were created by Kathryn Lybarger at the University of Kentucky, who also maintains documentation explaining what each report checks, why the results matter, and how to investigate and resolve the issues they uncover. I supplemented those with a handful of reports of my own, then built a Python script to run them automatically, track trends over time, and make my ongoing maintenance work a little easier to quantify.
The idea was straightforward: pull data from Alma Analytics, store it locally, generate reports, and let the computer handle the repetitive parts. The tricky part was realizing that “pull a report from Alma” was not a singular problem.
A few small assumptions had to be corrected: encoded paths are not always clean inputs, not every report returns a pre-calculated total, and not every number should be aggregated the same way. A monthly record count is a snapshot; a count of errors found or records corrected is activity. Treating those differently is what turns a collection of numbers into something meaningful.
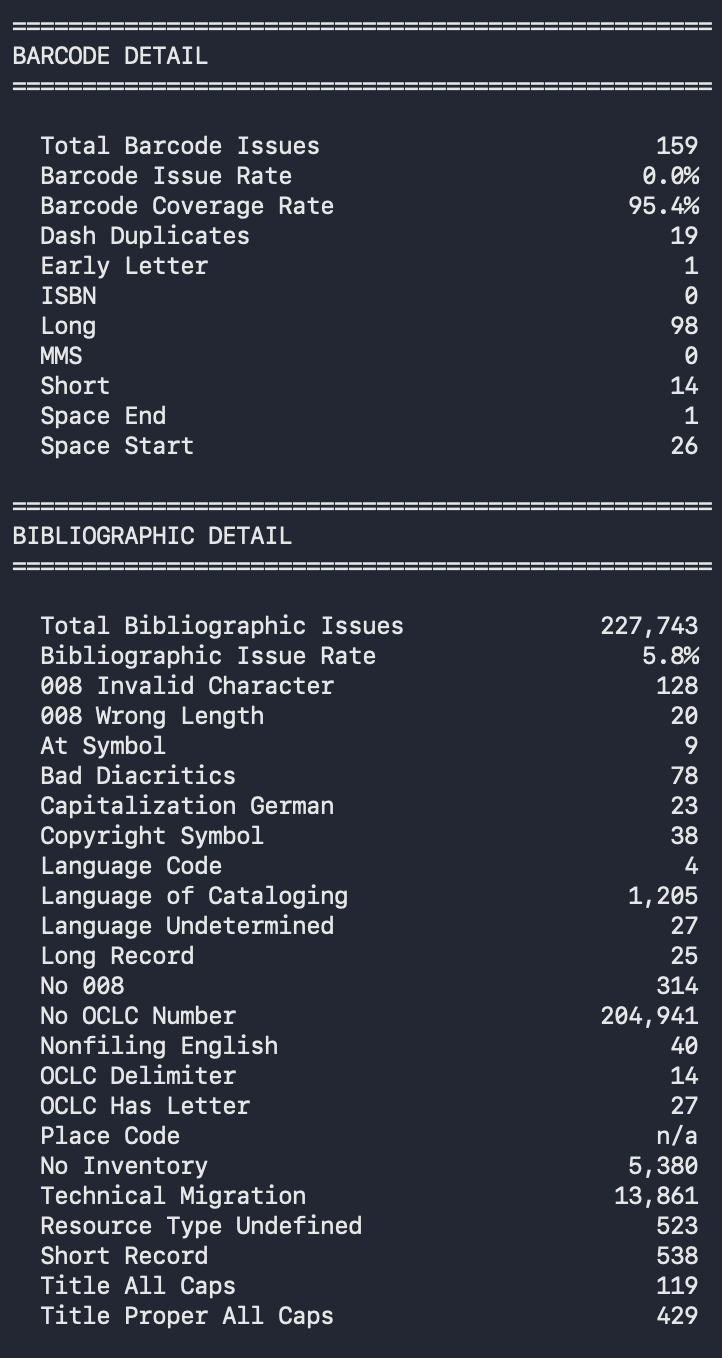
What I have now is intentionally boring. It pulls Alma data, tracks my work, generates trends, and gives me a clearer picture of what is happening across bibliographic records, holding records, item records, portfolios, and barcodes.
The spreadsheet is gone.
In its place is a small tool that does one thing well: helps me understand what is true about our systems and my work, one check at a time.